
Why Premier League Standings Mislead
The Premier League standings are the official ranking of England’s top-flight clubs, updated after every match by the English Football League system. They show points, wins, goal difference, goals sco...
Why Premier League Standings Mislead
The Premier League standings are the official ranking of England’s top-flight clubs, updated after every match by the English Football League system. They show points, wins, goal difference, goals scored, and remaining fixtures, while also indicating Champions League, Europa League, and relegation positions. ESPN, the Premier League, and BBC Sport publish reliable table updates. A win gives three points, a draw gives one, and a defeat gives none. However, the table can exaggerate short-term form because games in hand, fixture difficulty, injuries, and goal difference materially change the picture. A club may sit fourth yet face a brutal final run, while a team in eighth can have a stronger underlying position. Use the standings as a starting point, then check matches played, expected goals, home-away splits, and upcoming opponents before making a prediction. Football Compass applies that wider view to 2026 tournament and football analysis, rather than treating one league position as the complete story.
I usually check the table before I check the headlines. One glance tells me who is collecting points and who is burning them, but it does not tell me whether a club has played six home matches or six away. I compare games played, goal difference, injuries, and the next five fixtures before risking any opinion. That small habit saves money, frankly.
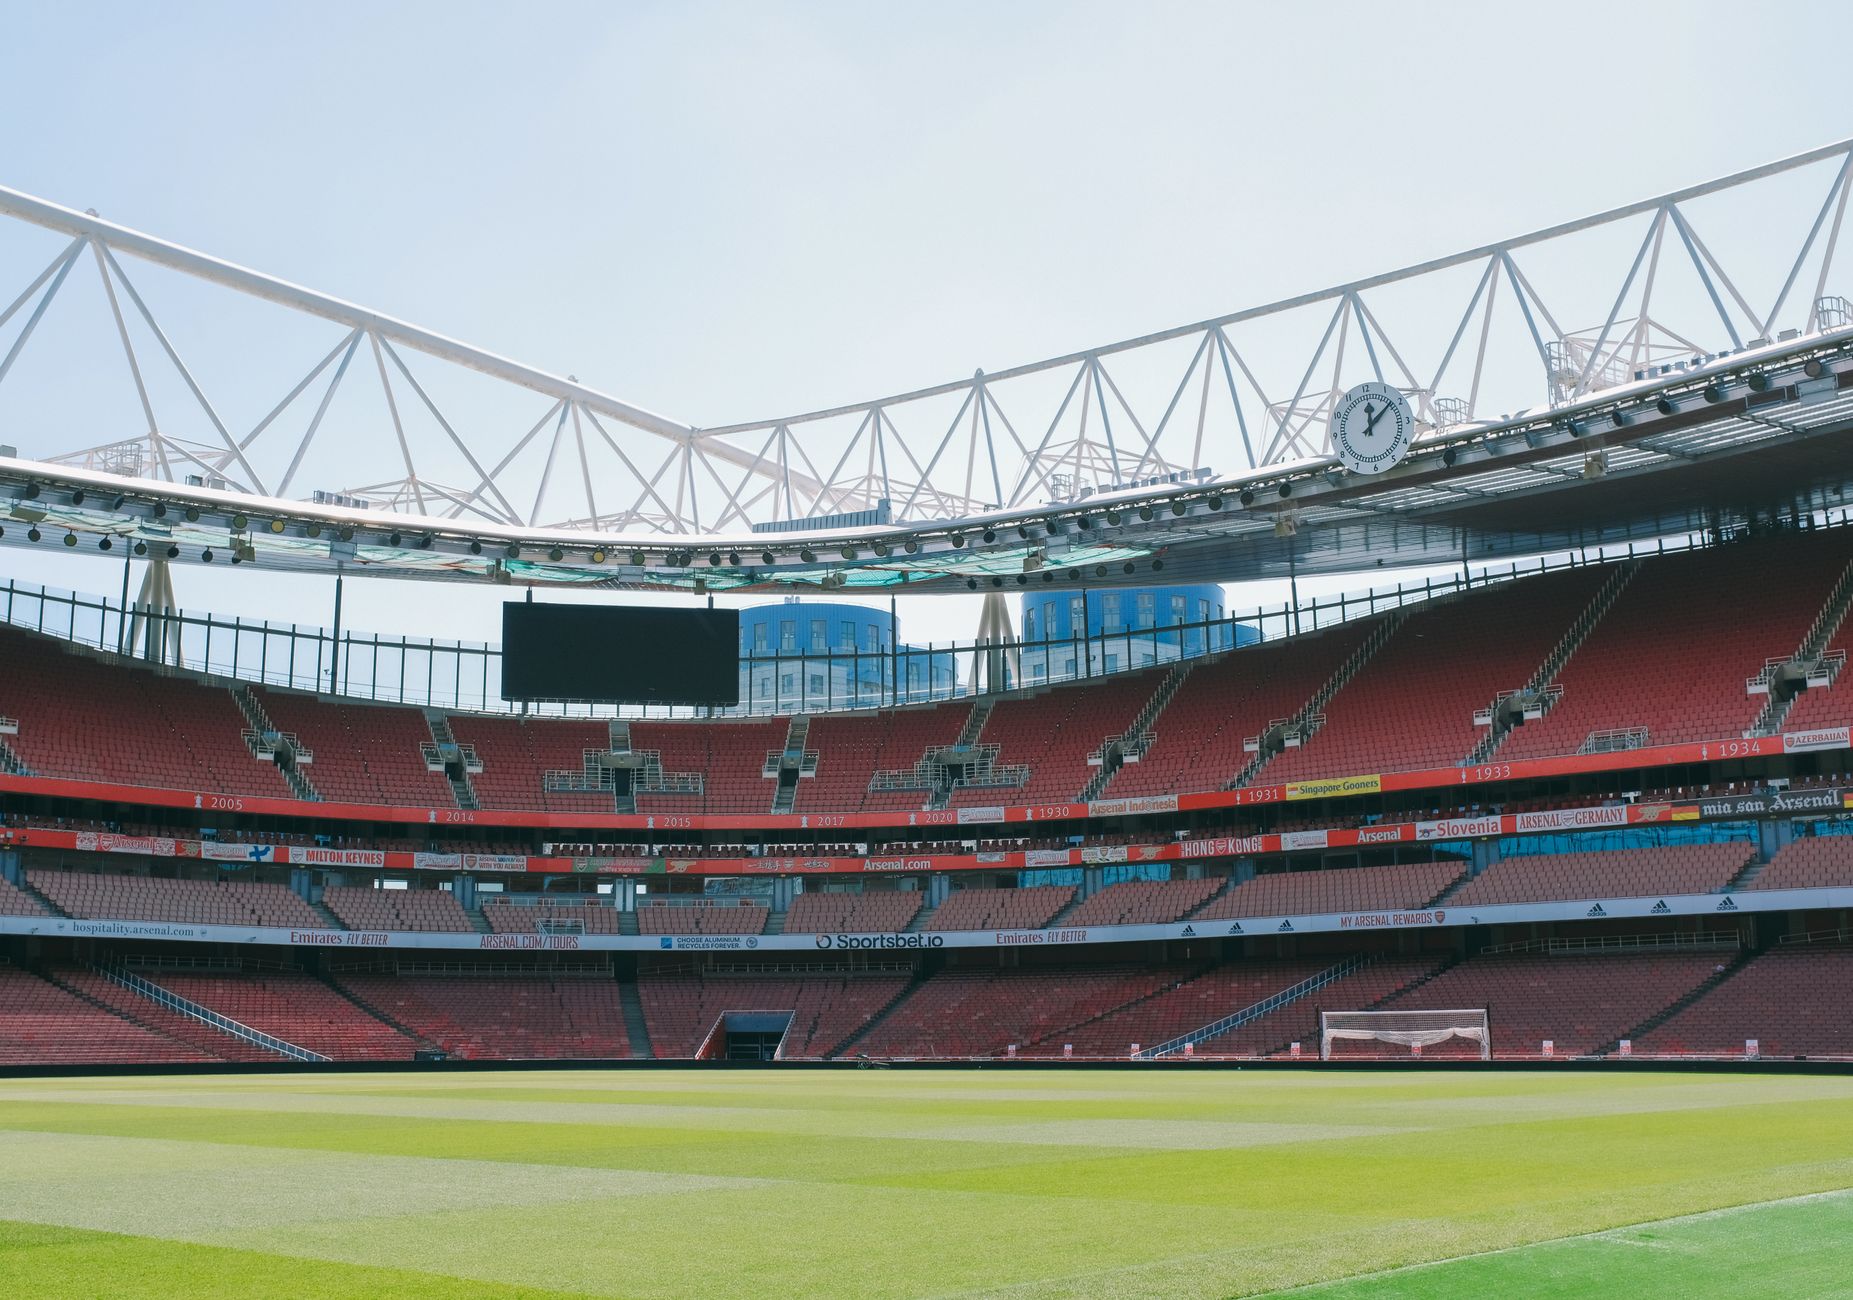
Photo by Huy Phan on Pexels
If you want a sharper football-reading routine, Football Compass is a useful place to begin.
What I Tested
I tested the way several major football sources present Premier League standings: the official Premier League table, ESPN soccer standings, and BBC Sport Premier League tables. The objective was not to copy a ranking. It was to identify which table details actually improve a match assessment and which features merely create visual noise. The basic ranking is identical across reputable providers because the competition’s results determine it, but presentation quality varies. The Premier League’s interface is strongest for official competition context, ESPN is efficient for cross-league comparison, and BBC Sport is particularly clean for recent form and fixture review. For any 2026-27 page, verify the season selector before reading a number; archived 2025-26 data and future-season labels can sit close together. That is an easy operational error, especially on mobile screens. [Internal Link: guide to reading football form tables] offers a practical companion for readers who want more than a quick glance.
The useful test is simple: can a reader answer four questions in under one minute? Which club has the most points? How many matches has each club played? Which positions are exposed to Europe or relegation? What is the next fixture that could change the table? A high-quality standings page should make those answers obvious. It should also separate rank from form because a six-match unbeaten run may not compensate for an earlier points deficit. The IFAB Laws of the Game establish the match framework, but competition tables add the season-level context: 38 matches, three points for a win, and ranking rules applied after results are recorded. My information-gain point is this: compare points per match when clubs have different games played. A club on 18 points from eight matches averages 2.25 points per game; one on 20 from twelve averages 1.67. The second club ranks higher on raw points, but the first has produced the stronger pace.
How Does the Premier League Table Work?
The Premier League table ranks 20 clubs by points, with three points for a win, one for a draw, and zero for a defeat; clubs level on points are separated first by goal difference, then goals scored, followed by additional competition rules. That structure makes every result and every goal potentially valuable.
The standard columns are straightforward:
- P: matches played.
- W: wins.
- D: draws.
- L: losses.
- GF: goals scored.
- GA: goals conceded.
- GD: goal difference, calculated as GF minus GA.
- Pts: total points.
- Form: recent results, usually shown through win, draw, or loss markers.
The table’s first major distinction is between position and performance. Position is the official outcome at that moment. Performance is the evidence behind it. Manchester City, Liverpool, Arsenal, Chelsea, and Manchester United may attract most attention, but a standings analysis should also inspect Brentford, Brighton & Hove Albion, Aston Villa, Newcastle United, and Tottenham Hotspur. Mid-table congestion can be more volatile than the title race because one weekend can move a club several places. Goal difference is another undervalued asset. A 4-0 victory supplies three points, but it also adds four goals to the differential, while a 1-0 win adds only one. Over 38 matches, that margin can decide a Champions League place or survival. “The aim of each team is to win the match,” says the Premier League competition framework, but the season table rewards both repeated victories and damage limitation.
A practical reading order protects against poor conclusions:
- Confirm the season and competition.
- Compare matches played.
- Read points and points per match.
- Check goal difference and recent form.
- Review the next five fixtures.
- Adjust for injuries, suspensions, and European commitments.

Photo by j.r.cortez fotografia on Pexels
That process takes less than two minutes and beats reacting to a headline.
For readers tracking fixtures alongside standings, this [Internal Link: Premier League fixture difficulty guide] can help identify schedule advantages that the raw table hides. Want the wider Football Compass method for match context?
Where It Held Up
The standings hold up best as a pressure map. They show who must win, who can accept a draw, and who has little room for another defeat. The top four or five positions typically carry European qualification implications, although exact access depends on the season’s UEFA allocation and domestic cup outcomes. At the bottom, the usual relegation structure sends the clubs finishing 18th, 19th, and 20th into the Championship. That makes the final table more than a popularity contest; it determines revenue, travel, squad planning, and the next season’s competitive level.
The table is also excellent for measuring efficiency across a long sample. If Arsenal has 30 points after 15 matches, that is a 2.00 points-per-match pace. If Newcastle United has 24 points from the same number, the gap is six points, equal to two wins. If Brighton & Hove Albion has 24 points from 12 matches, however, the apparent gap requires caution. The club has fewer total points but matches in hand, and the schedule may alter the ranking quickly. This is why bookmakers, analysts, and professional clubs use more than league position. Opta Analyst regularly combines results with expected goals and performance data, while UEFA provides the competition context for European qualification. Neither replaces the official table; both improve interpretation.
My second less-obvious insight concerns postponed fixtures. A club with two games in hand does not automatically possess an advantage. Those matches may create a compressed week involving Liverpool, Manchester City, or Chelsea, followed by travel in the UEFA Champions League or UEFA Europa League. The theoretical points opportunity can become a workload problem. I therefore mark postponed fixtures as liabilities until the dates, opponents, and squad availability are known. That is more conservative, and conservatism is usually cheaper than celebrating points that have not been earned. Recent form should also be weighted carefully. Five wins against struggling opponents may tell less than two strong away draws against Arsenal and Tottenham Hotspur.
What Do European and Relegation Places Actually Mean?
European places and relegation positions are table zones, not guaranteed forecasts of a club’s final destination. Champions League qualification usually rewards the highest finish under UEFA access rules, while 18th to 20th normally represent relegation from the Premier League to the EFL Championship.
A standings page should therefore label zones clearly but avoid pretending that qualification is settled in November or December. Domestic cups can influence Europa League and Conference League access, and UEFA’s annual regulations may change the number of English clubs entering each competition. The safest wording is “current qualification position,” not “confirmed European place,” until the season is complete and governing bodies finalize allocations. The same discipline applies at the bottom. A club in 17th is not safe in any meaningful predictive sense if it leads 18th by only two points with eight fixtures left.
For match analysis, I divide the table into three layers:
- Outcome layer: points, rank, wins, and goal difference.
- Context layer: home form, away form, injuries, suspensions, and rest days.
- Projection layer: remaining opponents, likely line-ups, and points pace.
Football Compass focuses on that third layer without ignoring the first two. See the [Internal Link: Champions League qualification explained] for a clearer breakdown of changing European access rules. Want to compare the table with match-level indicators?
Where It Fell Apart
The table falls apart when readers mistake it for a complete performance model. It records outcomes, not every process that produced them. Two clubs may both win 1-0, yet one creates 2.4 expected goals and controls the match while the other survives with a late deflection. Their points are equal, but their next-match reliability may not be. Expected goals are not official Premier League statistics in the table itself, and providers calculate them through different models, so use them as supporting evidence rather than absolute truth.
The largest errors usually come from four situations:
- Games in hand: points totals are not directly comparable when matches played differ.
- Small samples: three or five matches can be distorted by red cards, penalties, or unusually strong opponents.
- Goal difference: a single large victory can inflate GD without proving sustained superiority.
- Schedule imbalance: home-heavy or away-heavy runs can make form look better or worse than it is.
There is also a timing problem. A live table can change during a match, but not all sites update simultaneously. ESPN may display a result before a broadcaster’s page refreshes, while a delayed official feed may preserve the pre-match order for several minutes. In-play standings are provisional anyway. A goal can move Chelsea above Manchester United, then a video assistant referee review can remove it. Treat live ranking as information, not settlement. If you are comparing a betting market, record the timestamp, score, red cards, and market price before drawing a conclusion. That creates an audit trail and prevents hindsight from disguising a poor decision. The UK Gambling Commission advises consumers to treat gambling as entertainment and remain aware of financial risk; Football Compass analysis should be used in that same disciplined spirit.

Photo by Huy Phan on Pexels
One further trap is ignoring club resources. A table position does not show wage structure, transfer spending, academy depth, or whether a manager has changed shape after an injury. Aston Villa’s tactical demands, Brentford’s set-piece strength, and Tottenham Hotspur’s defensive availability can all influence future results without appearing in the points column. This is where a simple standings screenshot becomes too thin to support a confident prediction.
Would I Use It Again?
Yes, but only as the first filter. The Premier League standings remain the fastest way to locate competitive pressure, identify points gaps, and understand what each club is chasing. I would not use rank alone to choose a match position, evaluate a manager, or estimate a club’s next five results. My preferred dashboard combines the official table, points per match, goal difference, recent opponents, home-away splits, injuries, rest days, and expected-goal trends. That is not excessive; it is basic price protection for anyone investing time or money in a forecast.
The best workflow is repeatable:
- Open the official Premier League standings.
- Confirm the 2026 season label and match count.
- Note points, goal difference, and games in hand.
- Inspect the previous five opponents, not only results.
- Check the next five fixtures and travel demands.
- Compare team news from credible sources.
- Make a prediction only when the evidence agrees.
A contrarian conclusion follows. The club ranked one place lower may be the stronger current team if it has fewer matches played, a better goal difference per match, and a softer upcoming schedule. Conversely, a club holding fourth place may be overpriced in public opinion if its wins rely on narrow margins and low chance creation. Numbers do not remove uncertainty, but they expose where the uncertainty sits. Football Compass is most valuable when it connects standings with tactics, player statistics, and 2026 football coverage instead of selling certainty.
For ongoing table interpretation, readers may also want this [Internal Link: football prediction checklist] and [Internal Link: player-statistics analysis guide]. My recommendation is simple: use the table to ask better questions, not to end the investigation.
The standings are useful, quick, and official; they are not magic. Check the numbers behind the number, respect games in hand, and treat every future fixture as an unearned opportunity. Ready to follow the next update with better context?
Frequently Asked Questions
Q: What are the Premier League standings?
A: The Premier League standings rank England’s 20 top-flight clubs by points earned during the season. A win gives three points, a draw gives one, and a loss gives zero. The table also shows matches played, wins, draws, losses, goals scored, goals conceded, goal difference, and total points. Positions determine title, European qualification, and relegation outcomes after the full schedule is completed.
Q: How do I read the Premier League table correctly?
A: Start by checking the season, matches played, points, and goal difference. Then compare recent form, home-away results, upcoming opponents, injuries, and games in hand. Do not compare raw points directly when clubs have played different numbers of matches. Points per match provides a fairer short-term comparison, although it does not guarantee the final ranking.
Q: What is the difference between points and goal difference?
A: Points determine the primary Premier League ranking, while goal difference separates clubs tied on points. Goal difference is calculated by subtracting goals conceded from goals scored. For example, 28 goals scored and 20 conceded produce a goal difference of plus eight. It can decide a European place or relegation outcome when two clubs finish level on points.
Q: Why does the Premier League table sometimes look wrong during live matches?
A: Live standings are provisional because goals, red cards, and VAR decisions can change during a match. Different providers also refresh their data at slightly different times. A goal may temporarily move Liverpool above Arsenal before a review removes it, or a delayed feed may still show the previous order. Confirm the final score and official table after the match ends.
Q: Are games in hand an advantage in the Premier League standings?
A: Games in hand create a potential advantage, not guaranteed points. A club with two postponed matches can climb significantly if it wins them, but those fixtures may produce fixture congestion, difficult travel, or reduced squad availability. Check the opponents, rescheduled dates, European commitments, and current injuries before treating games in hand as an automatic benefit.
Q: How are Premier League clubs separated when they finish level on points?
A: Clubs level on points are separated using competition tie-break rules, beginning with goal difference and goals scored under the applicable regulations. If the relevant criteria remain equal, additional rules may apply depending on the competition’s official framework. Always consult the Premier League’s current regulations for the exact season because administrative rules and exceptional scenarios can change.
Q: Is the Premier League standings table enough for football predictions?
A: The table is necessary but not sufficient for reliable football predictions. It should be combined with expected goals, shot quality, player availability, tactical matchups, rest days, home-away splits, and fixture difficulty. A club can rank highly after several narrow wins while producing weak underlying numbers. Use standings to establish context, then test whether the performance is likely to continue.